
Instead of manually cross-referencing quarter-over-quarter figures in a spreadsheet or waiting on a data quality report from Cozero's team, you can now review flagged records directly in the platform, filter down to what needs attention, and act on them — dismiss, download, or delete — without leaving Cozero.
The dashboard runs two kinds of checks: log entry-level validations for individual records and aggregated validations for patterns across months (more on this below).
Who is this for?
Data Quality is built for anyone responsible for signing off on emissions data quality before it goes into a report — especially organizations managing emissions data across many business units, locations, or subsidiaries, where manual review doesn't scale.
- Sustainability managers preparing quarterly or annual emissions reports
- Data owners overseeing emissions logs across multiple business units or locations
- Teams that currently rely on manually built spreadsheets or on-demand data quality reports to catch missing entries, unexpected zeros, or suspicious spikes
How to access it
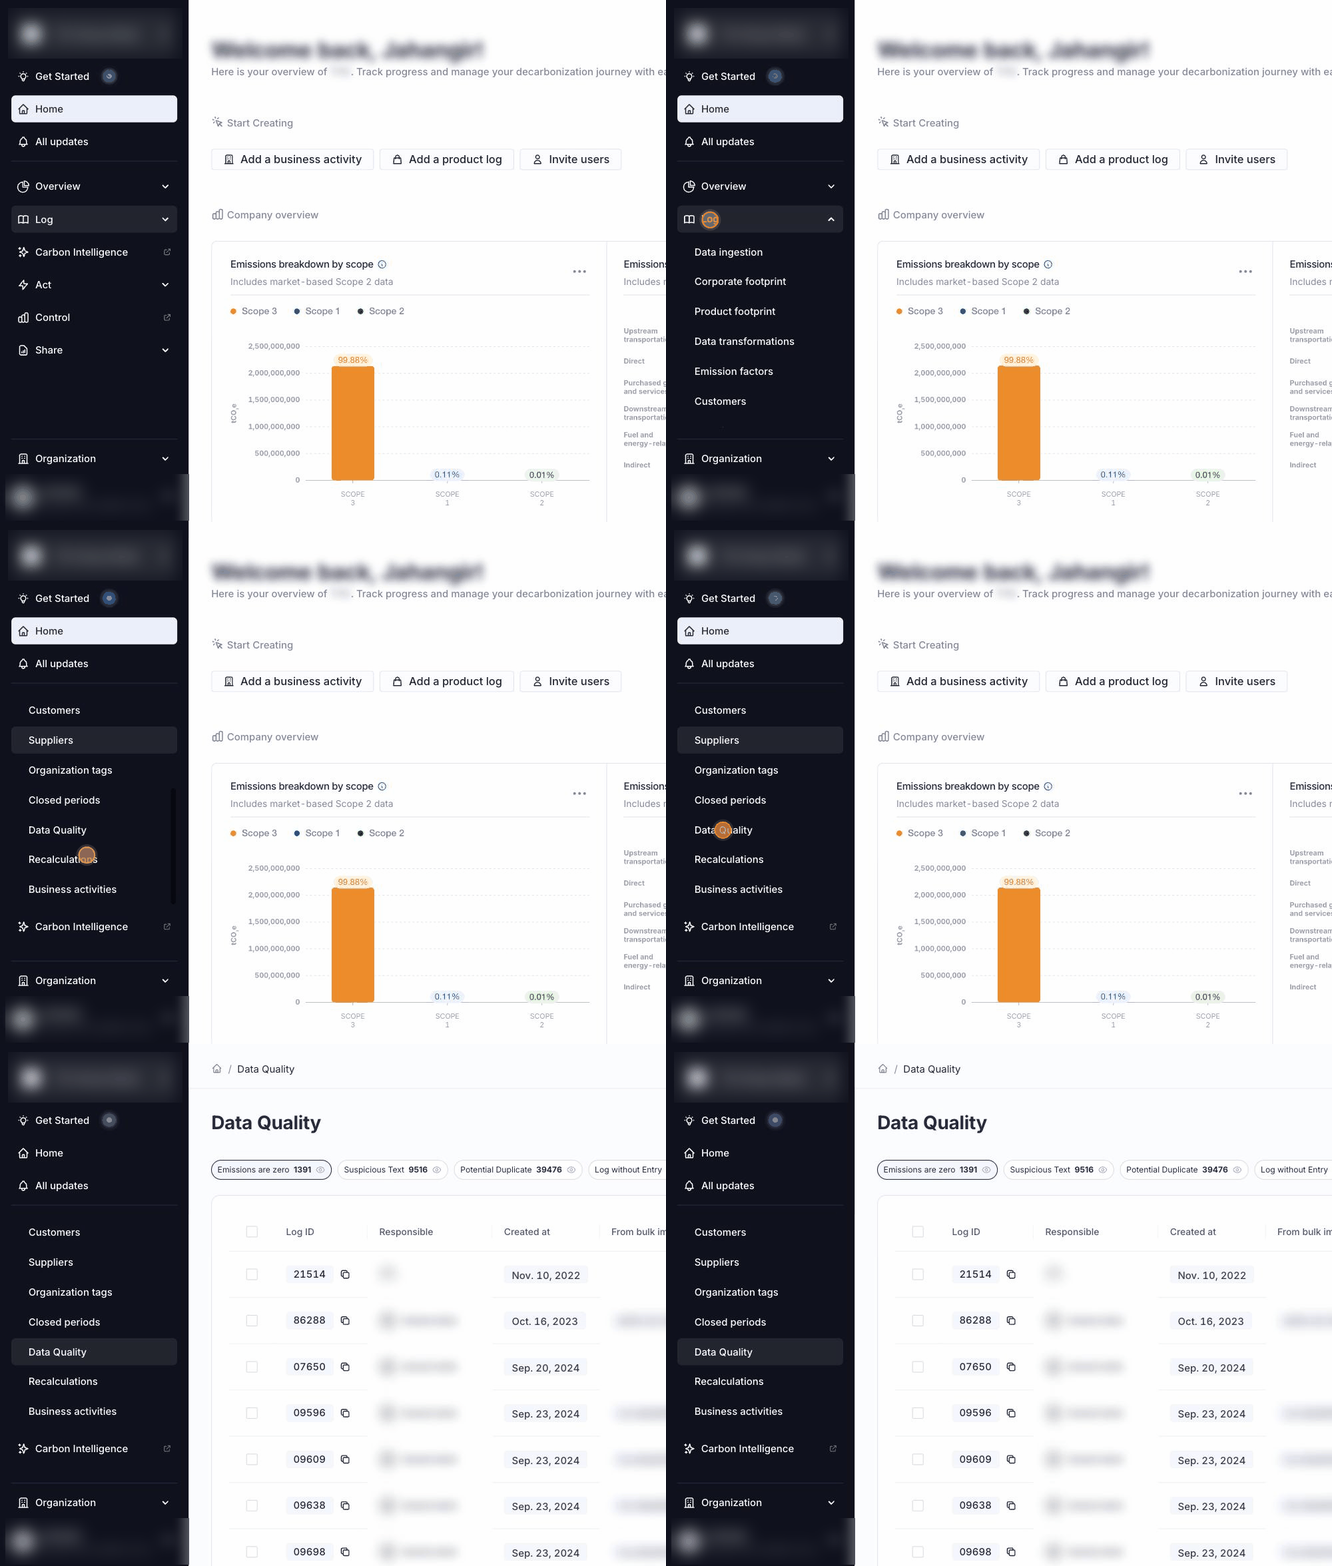
Navigate to Log > Data Quality in the left-hand sidebar of your Cozero workspace.
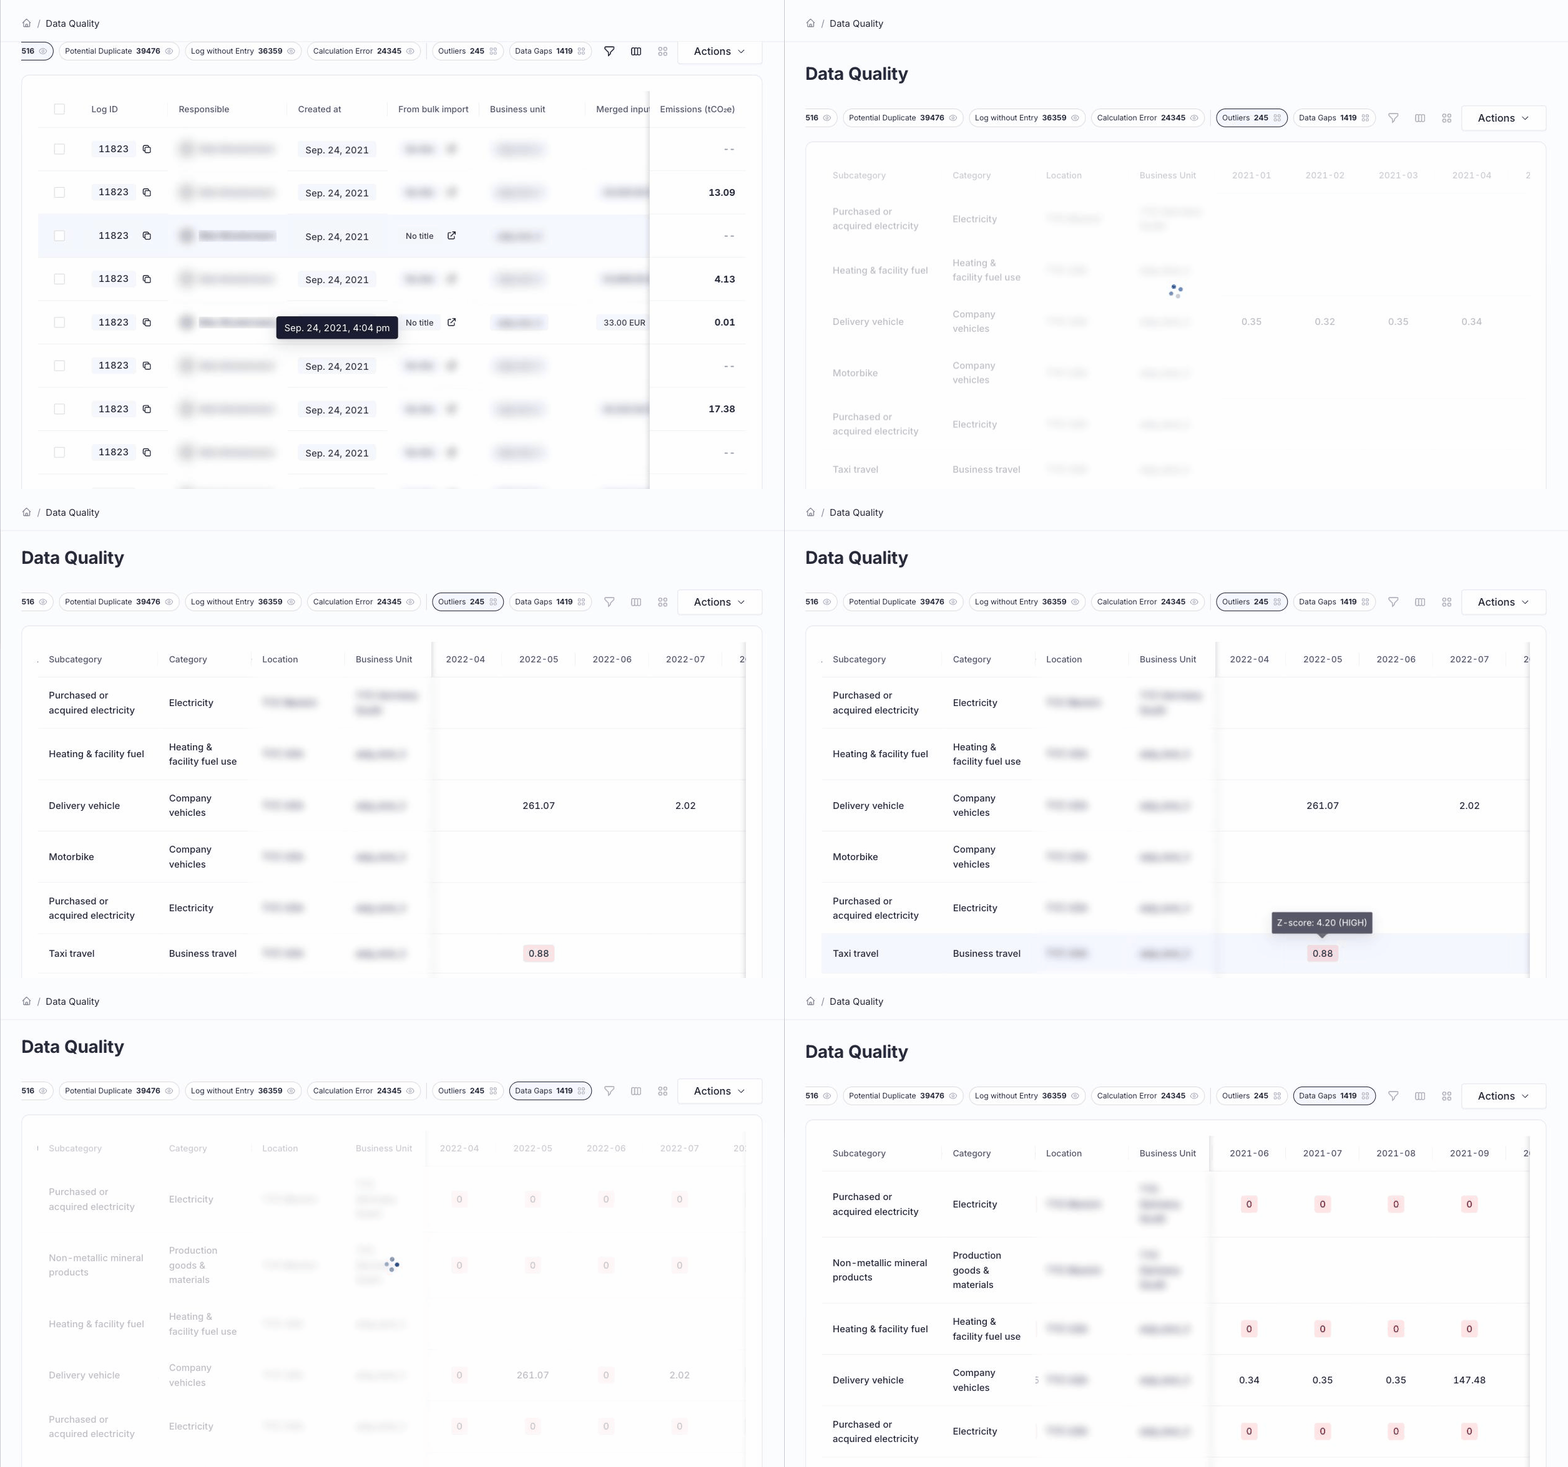
At the top of the page you'll see a row of filter chips indicating the categories of issues found in your data:
- Emissions are zero — entries where the result is 0 or missing
- Suspicious Text — entries with placeholder-style text (e.g. "test", "tbc", "demo")
- Potential Duplicate — identical entries that may be double-counted
- Log without Entry — logs with no entries recorded
- Calculation Error — entries with calculation issues
- Outliers — months with unusually high or low emissions for a location/subcategory
- Data Gaps — months with no data at all for a location/subcategory
Each chip shows how many records are flagged as potential issues. Click a chip to switch category (scroll the chip row horizontally to reach Outliers and Data Gaps). Use the filter icon to filter the table with the same fields as the Log Entry Overview, and the columns icon to show, hide or reorder columns. When a filter is applied, the chip counts update to match it. Filtering and column options aren't available for Log without Entry, Outliers and Data Gaps; these views always show all of your data.
Step-by-step guide
Step 1: Open the Data Quality dashboard
- In the left sidebar, expand Log.
- Select Data Quality.
- The table loads with all categories shown as chips across the top. On your first visit Emissions are zero is selected; later visits open on the last chip you used.
Step 2: Review flagged log entries
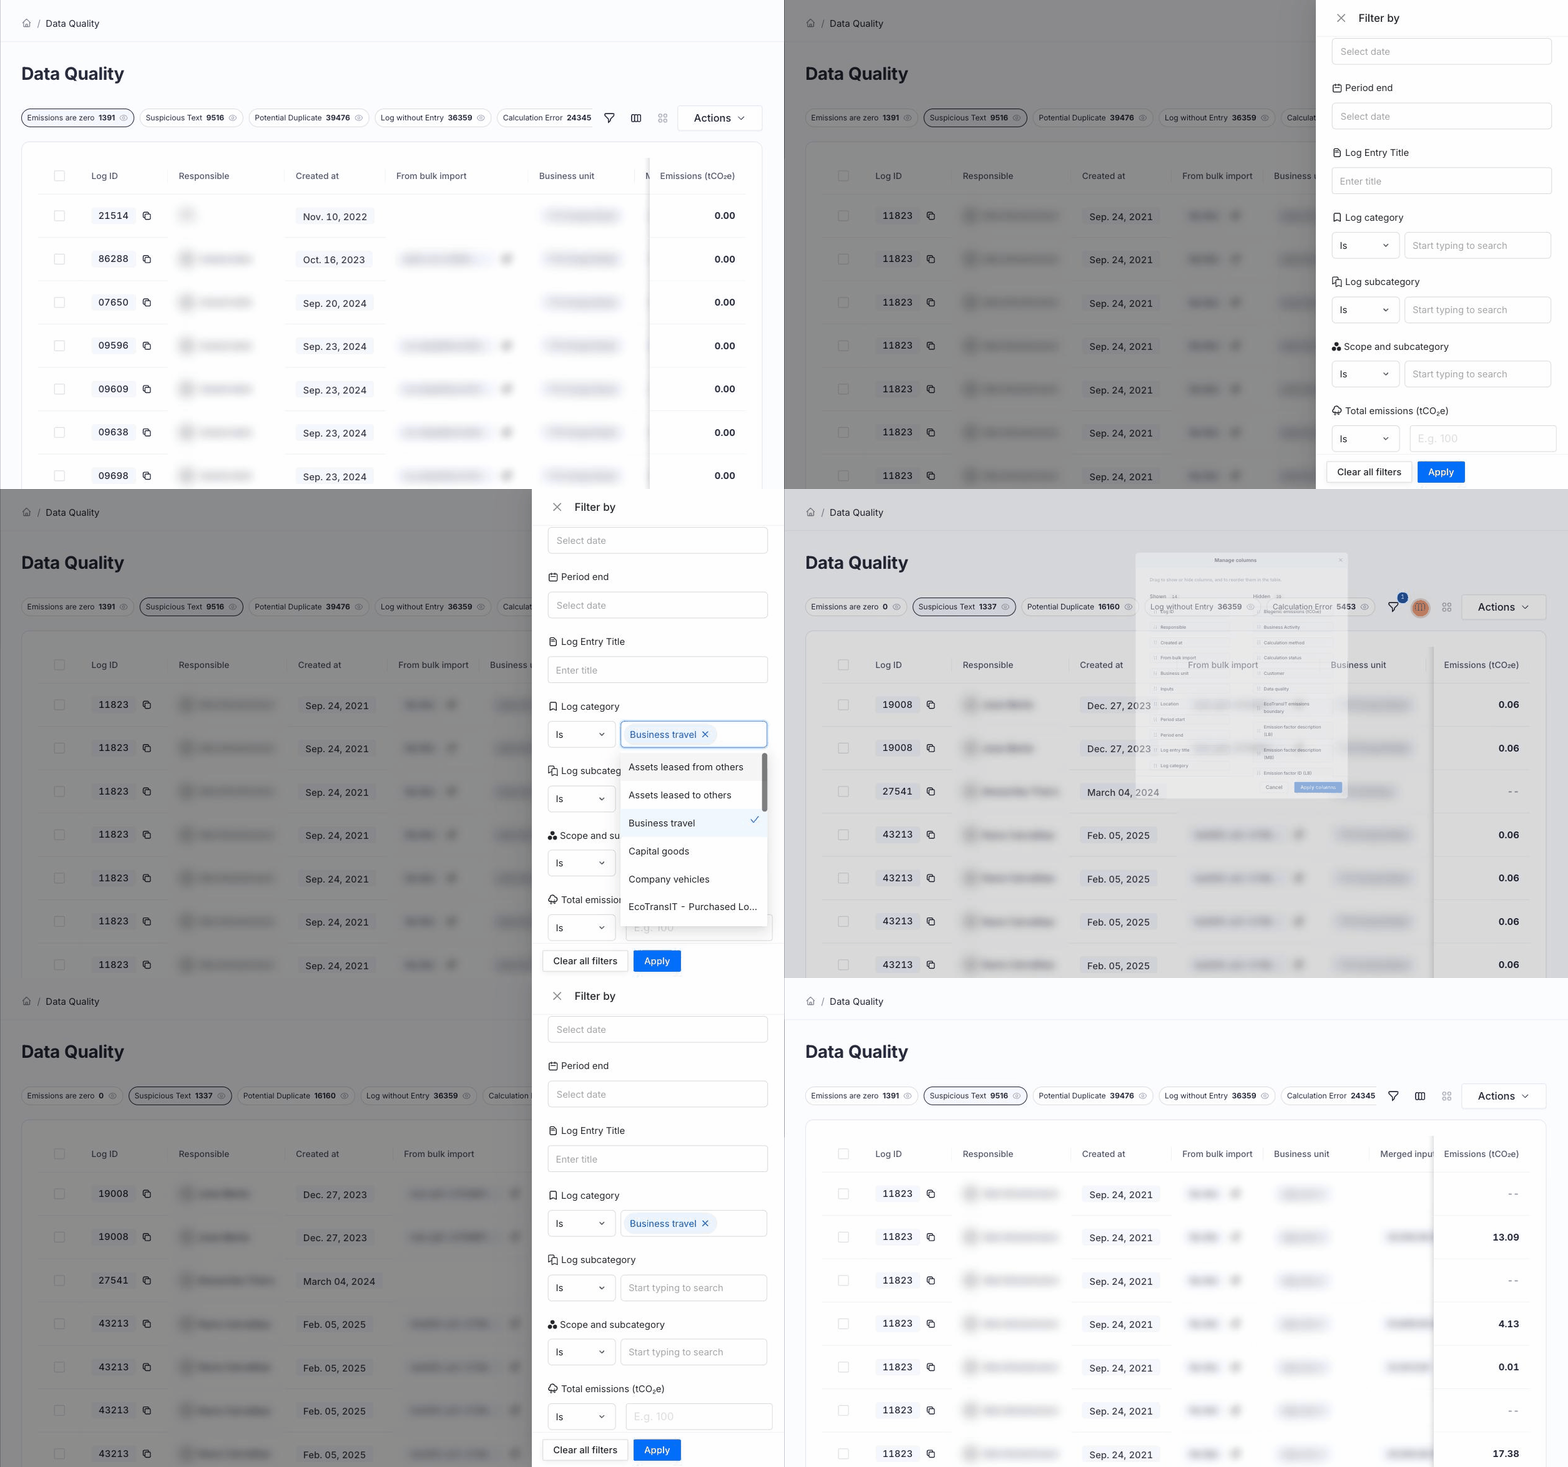
- Click a chip (e.g. Potential Duplicate or Suspicious Text) to filter the table to that issue type.
- Use the table columns (Log ID, Responsible, Business unit, Location, Period start/end, Log category, Log subcategory, Emissions and more) to see where the issue occurs.
- Click the filter icon to narrow results further, e.g. by category, location or business unit, then click Apply.
- To remove your filters, open the filter panel, click Clear all filters and then Apply.
- The Log without Entry view lists logs rather than entries, so it shows a shorter set of columns: Log ID, Log entry title, Business unit, Location, Period start and Period end.
Step 3: Investigate and take action
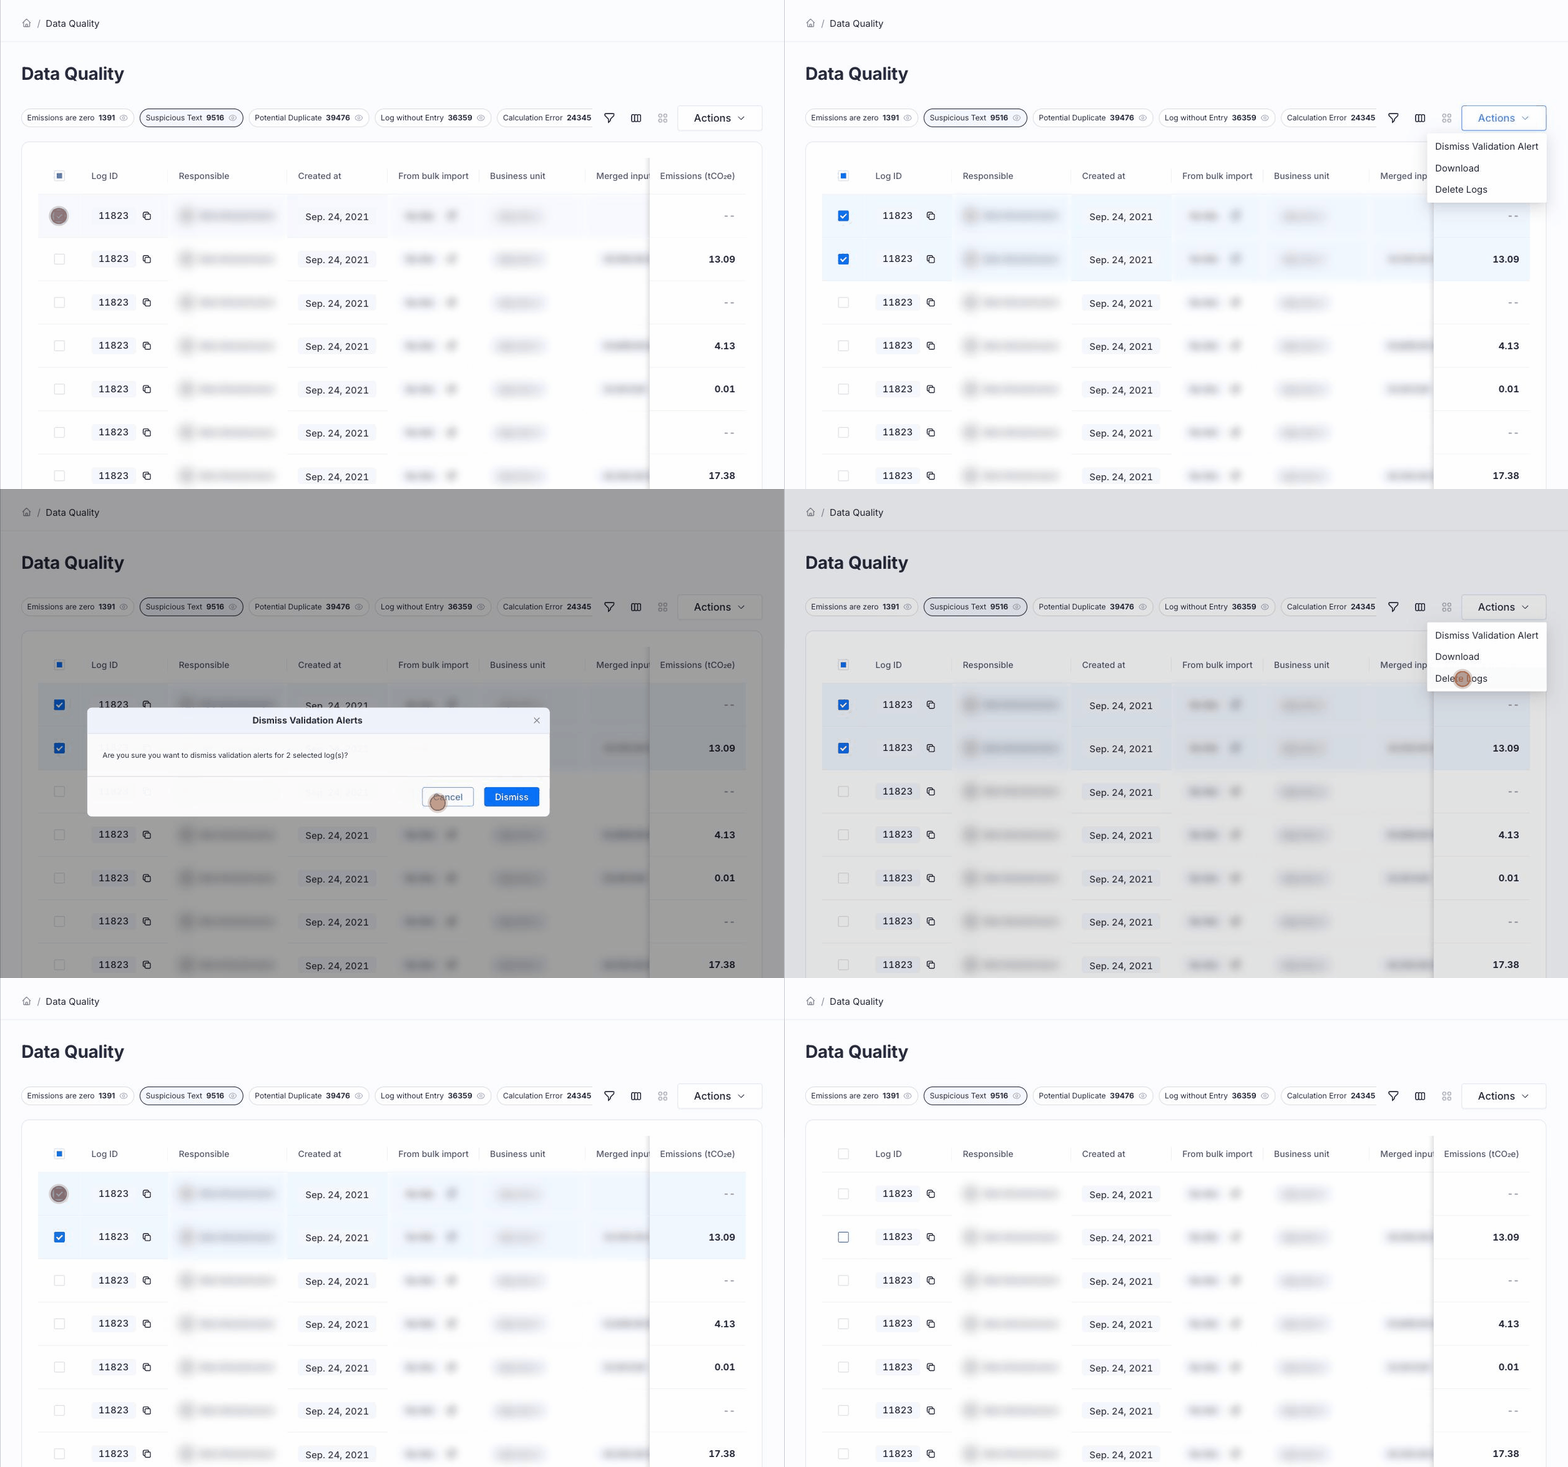
- Select one or more flagged rows using the checkboxes.
- Open the Actions dropdown to:
- Dismiss Validation Alert – if the value is confirmed correct (log entry-level validations only)
- Download – export the flagged list to share with the team responsible for fixing it
- Delete Logs – delete the underlying log entries, if appropriate (log entry-level validations only). Deleting is permanent: you'll be asked to confirm, and if all entries of a log are deleted, the log itself is removed too. Entries in closed periods can't be deleted.
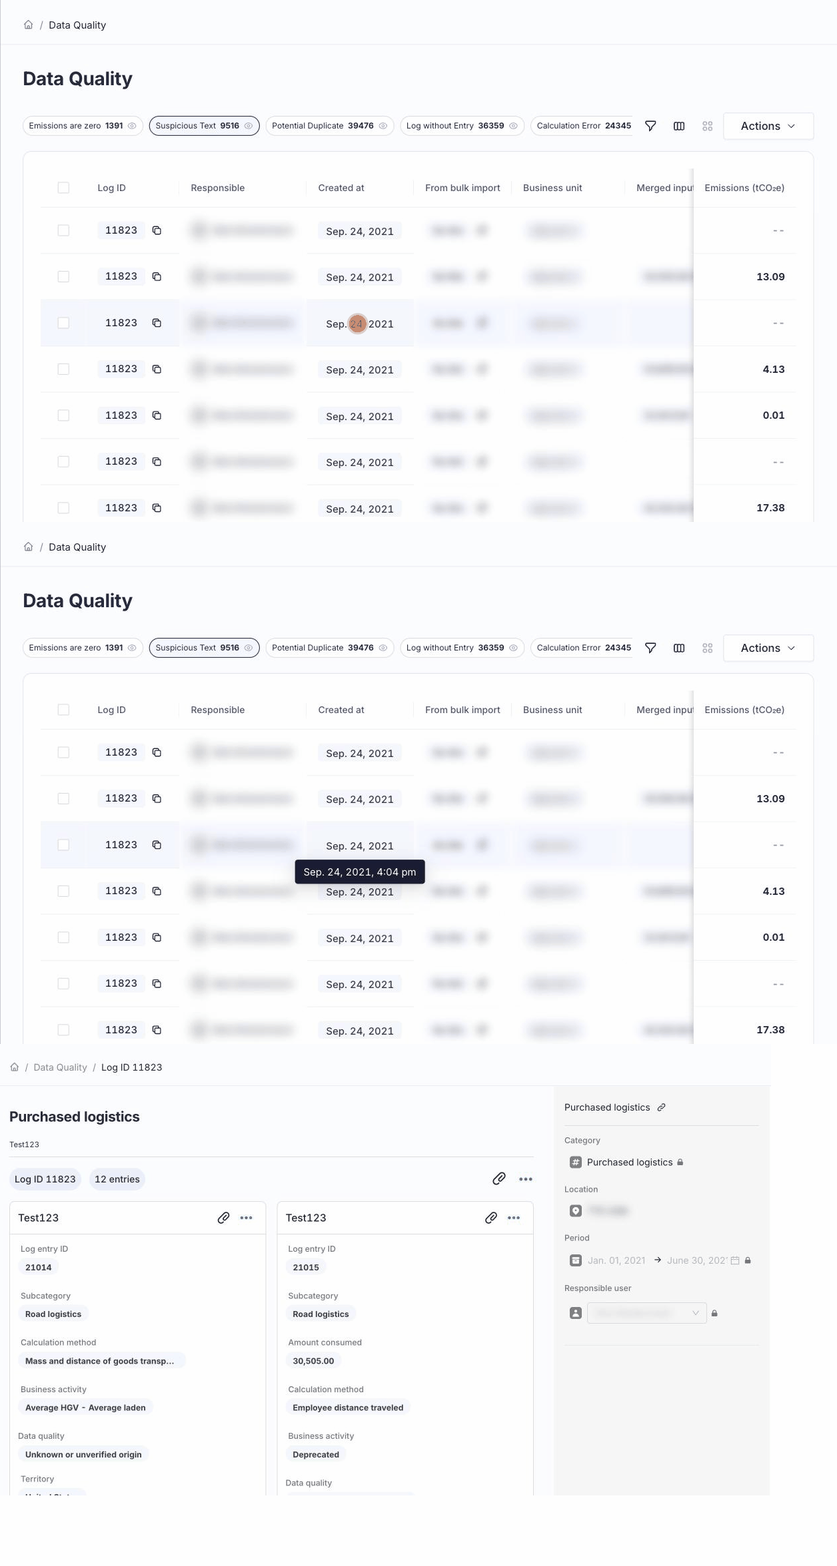
- Click a row to open that log's detail page in a new tab and edit it directly.
Step 4: Review aggregated validations (outliers and data gaps)
- Select the Outliers or Data Gaps chip. Results are grouped by subcategory, category, location and business unit, with one column per month.
- Flagged months are highlighted in red. Data gaps are shown as a red 0.
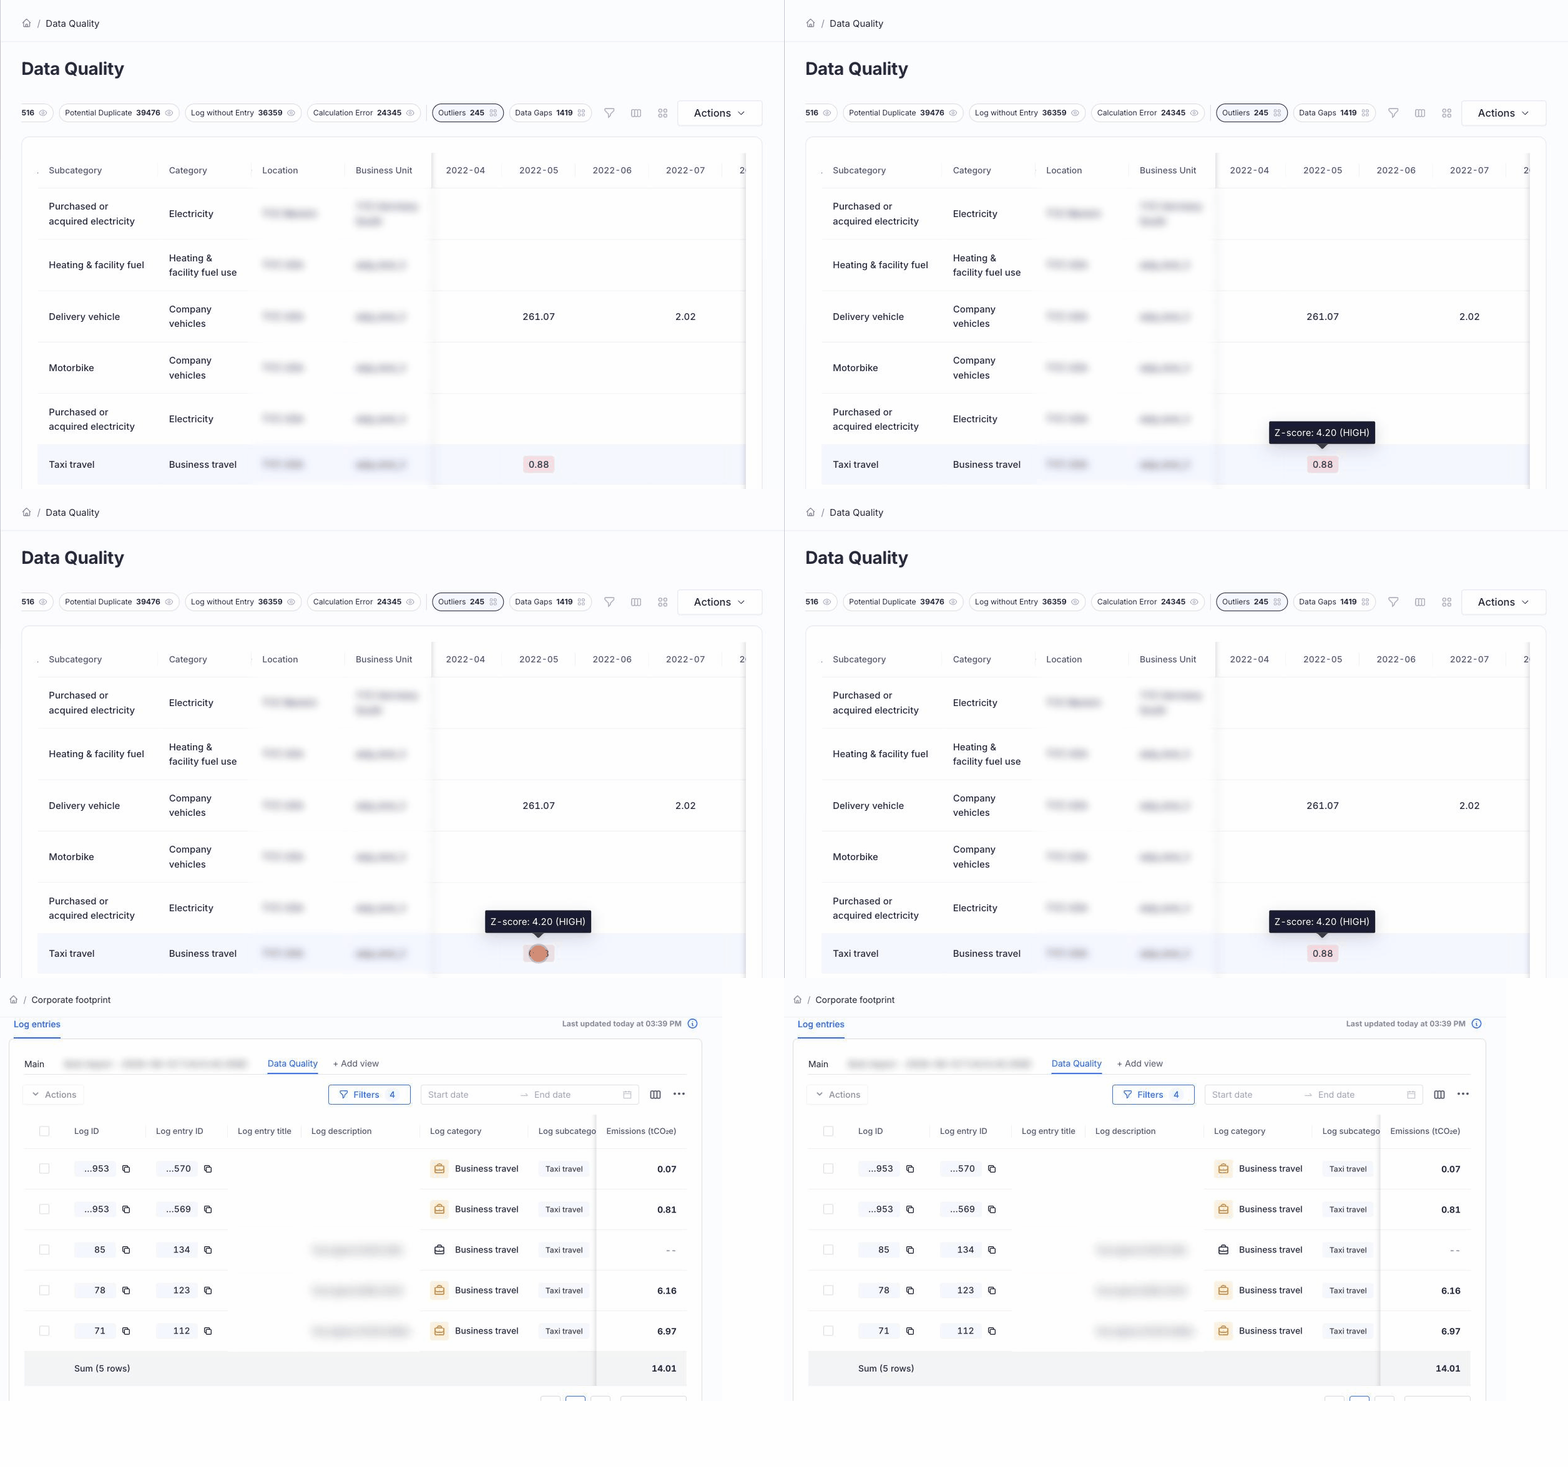
- For outliers, hover over the value to see its Z-score, e.g. "Z-score: 3.10 (HIGH)". The Z-score shows how far a month's value is from your usual level, compared with your own past values for the same location, subcategory and business unit. A value around 0 is average; the further it is from 0, the more unusual the month. HIGH means unusually high, LOW means unusually low.
- Click a flagged value to open the Log Entry Overview in a new tab, on a Data Quality view pre-filtered by location, category, subcategory and business unit. The view covers all periods, so set the start and end date to focus on the flagged month.
- Use Actions > Download to export the aggregated table.
Log entry-level vs. aggregated validations
Log entry-level validations check each record on its own — is this entry zero, duplicated, placeholder text, or part of a log with no entries? These are quick to fix one by one or in bulk. Aggregated validations compare months against each other to catch outliers and gaps that aren't visible from a single entry. They work best when you have a year or more of historical data.
Frequently asked questions
What counts as a "potential duplicate"? Two or more log entries are flagged when their key input fields — location, date, activity data source, and rounded input values — are identical, suggesting the same activity may have been logged more than once.
Why isn't every zero-emission entry flagged? A zero isn't always a problem — for example, renewable electricity with a zero emission factor. The Emissions are zero check excludes these expected cases, so you only see zeros that are likely to be genuine data issues.
Will Cozero automatically fix flagged issues for me? No. Data Quality flags issues for your review, but Cozero does not automatically change your data or push corrections back to your source systems.
What happens if I dismiss a flag? Dismissed flags are remembered, so a record you've confirmed as correct won't keep reappearing on future scans unless the underlying data changes.
Does this replace the data quality reports I currently request from Cozero's team? Data Quality is designed to give you the same visibility directly in the platform, reducing the need for manual, on-demand reports. Reach out to your Cozero contact if you still need a report for a specific case.
Can I add my own custom validation rules? Not currently. Custom validations, AI-driven pattern detection, and data enrichment are being considered for future iterations.
Questions or feedback
If you run into any issues or have questions, contact us at support@cozero.io.